Why characterise workload in UX?
Characterising the workload tied to a product, an interface or a service is useful in various contexts. During a creation, optimisation or redesign process, for example. This characterisation lets you identify elements that have a strong impact on usability (in the ISO 9241-11 sense3). To do that, you cross it with verbal user feedback and performance markers (e.g. success rate).

What approach should you take to characterise workload in UX?
It would be tempting to use physiological indicators (e.g. pupil dilation) to assess workload. Same goes for biomechanics (e.g. level of muscle activation). The combination of technology and signals displayed on a screen is reassuring through its strong marketing appeal. But beyond the cost of the tools involved, the expertise and time required for their analysis make these heavy approaches. That doesn’t seem very compatible with efficient real-world use in UX.
Also, the precision useful for the creation or redesign of a project often concerns the overall task. Subjective tools such as questionnaires remain sensible time/results investments. The NASA-TLX questionnaire is one of these tools.
Feedback on the NASA-TLX
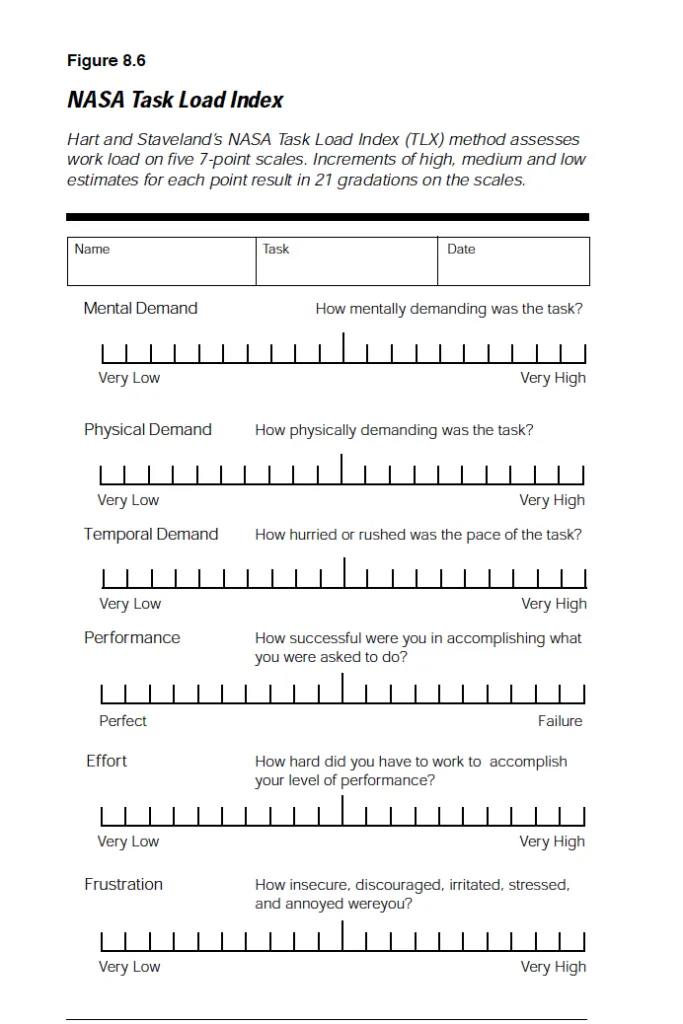
For those who would like to know everything about the NASA-TLX, we invite you to check out this clear introductory article4. For the others, what you need to remember is that the NASA-TLX is a questionnaire made up of 6 workload components. These are: mental demand, physical demand, temporal demand, self-rated performance, effort, and frustration. Each item is presented as scales going from “low” to “high”. So 21 unnumbered graduations, translating to scores ranging from 0 to 20.
And in practical terms, what can we say about this questionnaire?
Administration
The original method calls for a two-step administration. It is possible to skip the weighting step (see the “analysis” paragraph).
Self-assessment
Following the weighting phase, users place a mark or a cross on the scales to self-assess how they felt. This step is repeated after each task (or sequence of tasks) carried out. The total time to fill it in rarely exceeds 2 minutes, but a few points are worth watching:
-
users have to place their marks/crosses on the graduations, not between them. The risk? Falling back on a 20-point scale (and therefore a score ranging from 0 to 19);
-
the “temporal demand” item is often misunderstood. By rewording it verbally as “time pressure to reach the objectives”, users no longer have doubts and answer easily;
-
the “effort” item is often misunderstood, because it is perceived as redundant with the “mental demand / physical demand / temporal demand” items. It’s worth indicating that this item corresponds to an overall sense, to make it easier to understand;
-
users often make the mistake of scoring good self-rated performance by placing their marks towards the right end of the scale. An explanation? Counter-intuitively, the scale is built from left to right with a “0” for “good performance” to a “20” for “poor performance”. And it isn’t a scale-building error. From the cognitive load point of view, the labels at the right end all correspond to high workloads. So be careful and make sure your users have properly understood this subtlety.

Weighting
The items are presented in pairs: the participant has to indicate which of the 2 items prevails in their sense of the workload tied to the task. Let’s take a chess game as an example. The first pair presented will be “mental demand vs physical demand”. The user has to indicate whether the workload felt during the chess game was rather tied to mental demand or to physical effort. A pretty obvious answer, right? Yes, except that it’s much less intuitive if you take Formula 1 driving. Hence the value of this phase.
The same process is then repeated for each possible pair of items: “mental demand vs temporal demand”, then “mental demand vs self-rated performance”, and so on. In total, the user runs through 15 comparisons. This phase will let you weight the scores of each item during the analysis phase.

It’s worth noting that in the original version, the weighting was done after the self-assessment of each dimension. Since then, references can be found suggesting the opposite order. We’ll let you form your own opinion.
Analysis
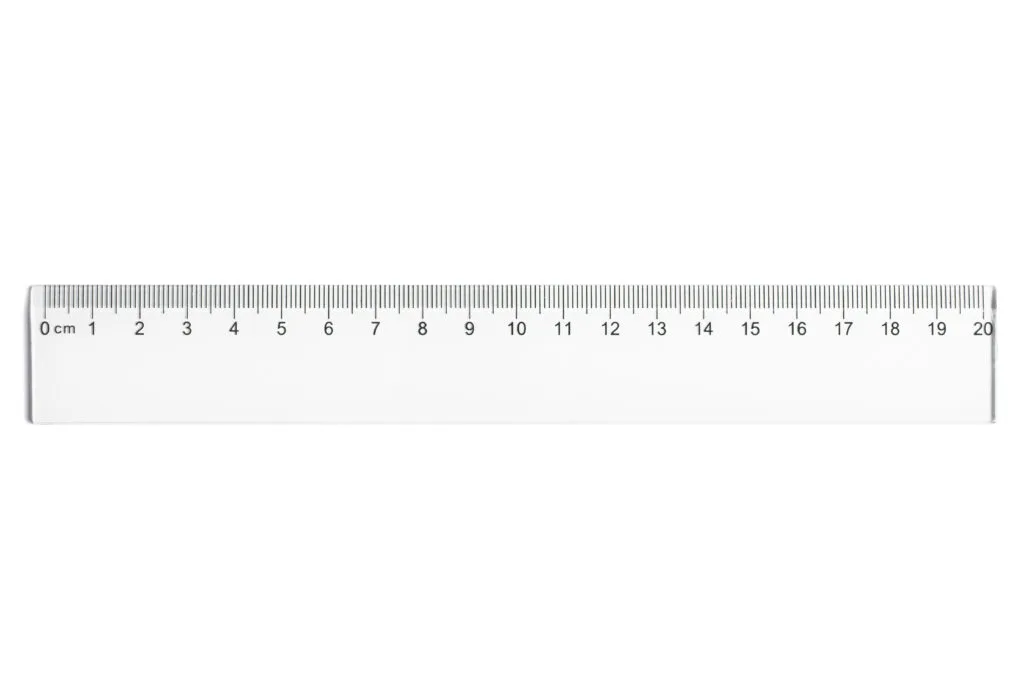
If you don’t run the questionnaire on a computer (or tablet/smartphone), you’ll have to read the scores of the respective scales yourself on the paper questionnaires. A tip to save time: print the questionnaires with scales that are 20 cm long. You’ll just have to use a 20 cm ruler to read the scores marked by users, instead of counting the graduations. A questionnaire is then analysed in 1 minute, while minimising errors (and lowering the workload 😅).
What about the scores obtained for each item: should you add them up? Average them? Keep them separate? Two pieces of an answer:
-
The weighting phase described earlier lets you allocate a weight to each item. This weight can be considered 1) as a way to prioritise the items relative to one another when they are interpreted separately, or 2) as a way to weight the scores obtained per item in the calculation of an overall workload value. In this second case, the overall score sums the scores of each item, each multiplied by its weight (the number of times the item was chosen as the one most appropriate to describe the workload tied to the task). The total is divided by the sum of the weights (15) to give a score out of 20, then multiplied by 5 to give a score out of 100.
-
It has also been reported that the 6 items are correlated with one another5, which leads the author of the analysis to think that the 6 items probably measure the same underlying process. Although we should remain cautious until proven otherwise, it is possible to use the items separately and without weighting (saving time and easing analysis), for the purpose of interpreting the results.
Interpretation
There is no threshold value today from which we can claim that a task induces too high a workload. As a result, it’s appropriate to combine the quantitative results with verbatims and performance markers, so they can feed the thinking around workload.
For example:
- Intuitively, if the NASA-TLX score is high and tied to poor performance on the task, one path could be to reduce the workload of the task to push performance up;
- conversely, if the NASA-TLX score is low and tied to poor performance on the task, one path could be to make the task more complex, to raise the workload and reach better levels of engagement with the task.
It’s also worth remembering that such a score is useful in A/B testing campaigns: while we can’t say whether projects A and B are too impactful or not impactful enough in terms of workload, we can say whether one is more so than the other by comparing the scores.
One way to go beyond the difficulty tied to the current absence of a threshold value would be to compare the task being explored with a reference condition. That would come down to A/B testing, where A would be a reference task and B the task to assess.

To finish
Most of the points raised above can be overcome by running the test on a tablet/smartphone/computer. That said, it has been shown that the paper and digital versions don’t report strictly the same results. So make sure to keep the same measurement methods between users, between tasks and between test sessions.
At AKIANI, we’ve been using this questionnaire for quite some time now, in particular in our neuroergonomics work (e.g. for cognitive training of esport players), but also in UX (e.g. for designing interfaces for autonomous vehicles).
So, are you tempted to give it a go?
References
1 - Laussu, J. (2018). Charge de travail et ergonomie : histoire et mobilisation d’une notion. Revue des conditions de travail.
2 - Leplat, J. (1977). Les facteurs déterminant la charge de travail : rapport introductif. Le Travail Humain, 40:2.
3 - www.iso.org/fr/standard/63500 (opens in new window)
4 - measuringu.com/nasa-tlx/
5 - Hart, SG (2006). NASA-Task Load Index (NASA-TLX); 20 years later. Human Factors and Ergonomics Society Annual Meeting Proceedings, 5:9